Latency numbers of different golang operations
Latency is one of the most important metrics in system performance, different systems have various latency requirements, such as the read latency of a relation database maybe less than 50ms, the GC latency of a programming language should be less than 10ms or 1ms, while the latency requirement of two micro services under the same data center could be less than 0.2ms. It is not always latency sensitive in every single part of a system, but as a matter of fact there do exist many components that are latency sensitive and we must be very careful when we design and implement these components or systems.
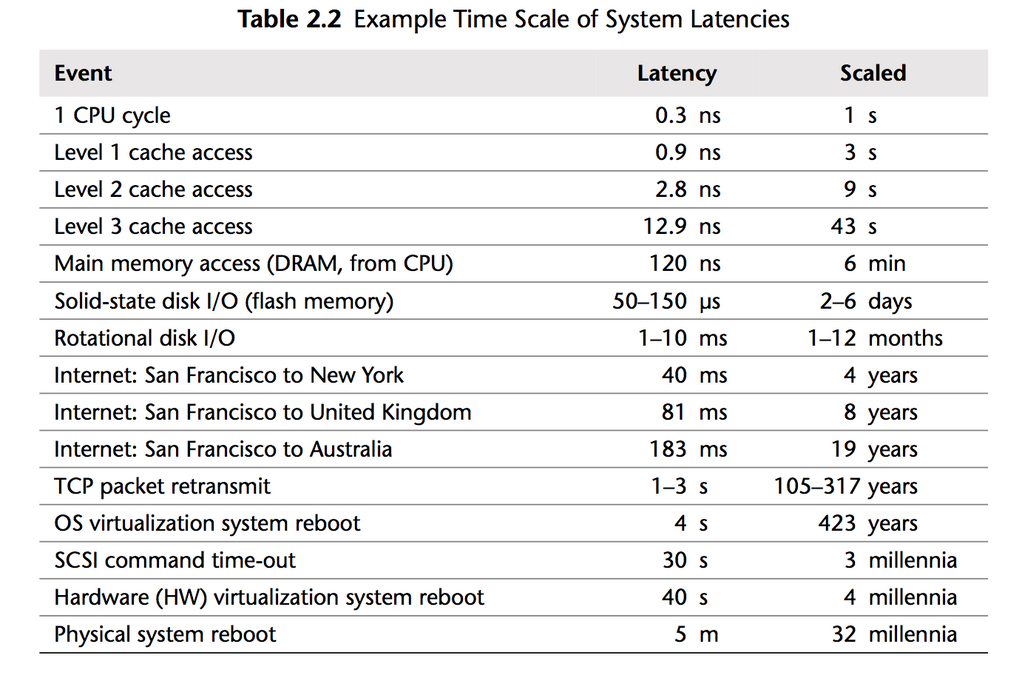
A lot of articles have talked about system latency, from both the high level, macroscopic perspective, such as the latency of a complex architecture; the latency from systemic interaction such as http API invocation, database read and write, cache access; the latency of operation in programming language such as memory allocation or function call. And the low level, or the underlying system, such as the latency in memory access, IO access, TCP packet transmit, etc. The following latency table is from book Systems Performance, and the project napking-math also provides a table about latency numbers.
In this article I will focus on the latency in Golang programming language, including API in some golang libraries; golang specific feature such as goroutine create and destroy, channel access; golang runtime latency such as GC latency etc.
The latency numbers table
| Operation type | Golang latency | Benchmark environment | Benchmark source |
|---|---|---|---|
| Empty function call | 0.4 ns | Based on concurrent count and cpu count, benchmark run with cpu Intel(R) Xeon(R) CPU E5-2630 v3 @ 2.40GHz, go version 1.16.3 | A pure go empty function call |
| RWMutex RLock + RUlock | 15-40 ns | Based on concurrent count and cpu count, benchmark run with cpu Intel(R) Xeon(R) CPU E5-2630 v3 @ 2.40GHz, go version 1.16.3 | ref: go issue, RWMutex scales poorly with CPU count |
| Cgo function call | 70 ns | Benchmark run with cpu Intel(R) Xeon(R) CPU E5-2630 v3 @ 2.40GHz, go version 1.16.3 | ref: cgo benchmarks |
| Select on a channel | 10-100 ns (case1) 100-700 ns (case2) |
Based on the lock contention in runtime.sellock and runtime.selunlock, benchmark run with cpu Intel(R) Xeon(R) CPU E5-2630 v3 @ 2.40GHz, go version 1.16.3 |
ref: go issue runtime: select on a shared channel is slow with many Ps case1: private channel case2: shared channel |
| Thread-safe buffer to simulate a channel | 100 ns (case1) 400-500 ns (case2) 400-500 ns (case3) |
Benchmark run with cpu Intel(R) Xeon(R) CPU E5-2630 v3 @ 2.40GHz, go version 1.16.3 | ref: So just how fast are channels anyway case1: single writer and reader case2: single writer, multiple readers case3: multiple writer and readers |
| Create a goroutine and call WaitGroup done once | 300-800 ns | Benchmark run with cpu Intel(R) Xeon(R) CPU E5-2630 v3 @ 2.40GHz, go version 1.16.3 | ref: benchmark code |
| Golang grpc: unary secure ping pong | 200-300 us | 8-core systems on GCE, gRPC official benchmark | netperf: 70-80us c++: 130-200us ref: grpc testing dashboard and grpc benchmarking |
| Golang grpc: streaming secure ping pong | 150-200 us | 8-core systems on GCE, gRPC official benchmark | netperf: 70-80us c++: 100-140us ref: grpc testing dashboard and grpc benchmarking |
| Go 1.8-1.9, STW pauses per GC | < 2*500 us | Golang official benchmark | ref: Getting to Go: The Journey of Go’s Garbage Collector |
| Go 1.7-1.8 GC | 1.5 ms | Golang official benchmark | ref: Getting to Go: The Journey of Go’s Garbage Collector |
| Go 1.5 GC, STW pauses every 50ms | 10 ms | Golang official benchmark | ref: Go GC: Prioritizing low latency and simplicity |
Summary
In the real world system could be far more complicated than the above cases, latency of the whole system is contributed by pieces of code/logic, knowing the latency of each single part is not the silver bullet, but the foundation of performance tuning. Besides we can use some profile and trace tools to diagnose the system performance, such as the cpu profile and trace tools shipped in golang pprof. At last I will quote some advice about performance tuning given by Dave Cheney in the High Performance Go Workshop in a gopher conference.
Start with the simplest possible code.
Measure. Profile your code to identify the bottlenecks, do not guess.
If performance is good, stop. You don’t need to optimise everything, only the hottest parts of your code.
As your application grows, or your traffic pattern evolves, the performance hot spots will change.
Don’t leave complex code that is not performance critical, rewrite it with simpler operations if the bottleneck moves elsewhere.
Always write the simplest code you can, the compiler is optimised for normal code.
Shorter code is faster code; Go is not C++, do not expect the compiler to unravel complicated abstractions.
Shorter code is smaller code; which is important for the CPU’s cache.
Pay very close attention to allocations, avoid unnecessary allocation where possible.